Constructing the Three-Dimensional World of Speech Events
By Giovanni Bennardo and Kurt Schultz, Northern Illinois University
This article describes the Digitized Tonga database project, the construction of a geographically and ethnographically very detailed three-dimensional representation of Tonga, Polynesia. This digital representation creates a rich landscape for extensive and in-depth analyses of linguistic and ethnographic data. The article provides a detailed description of the process by which the two-dimensional representation created by GIS (Geographic Information System) and the three-dimensional representation of the speech events under analysis was obtained. We also illustrate how digital video clips of interviews are simultaneously displayed on the computer screen with these two representations, thus helping the analysis of linguistic data.
Figures and Appendices in Color:
Figure 1
Environmental Systems Research Institute data about Tonga. [ESRI 1998]

Figure 2
Digital Tonga (with enlarged inset of the island of Vava’u).
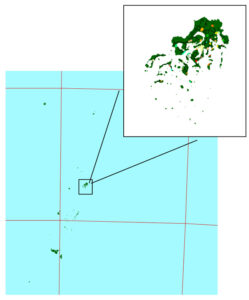
Figure 3
Digital village of Houma, Vava’u, Tonga, with sample information linked to houses.
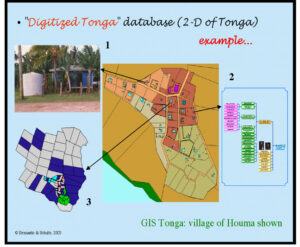
Figure 4
Two-dimensional view of T’s two visual takes.
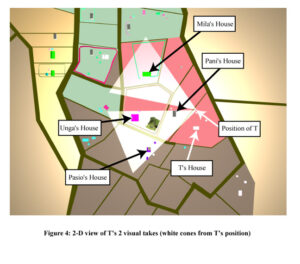
Figure 5a and 5b
5 a: Three-dimensional overview of T’s two visual takes.
5b: Three-dimensional view of T’s visual field.
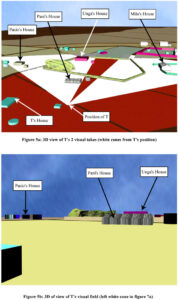
Figure 6
Two-dimensional view of L’s three visual takes.

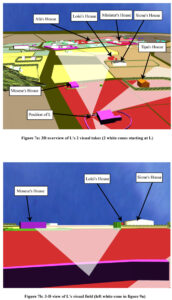
Figure 7a and 7b
7a: Three-dimensional overview of L’s two visual takes.
7b: Three-dimensional view of L’s visual field.
Appendix A
Three-dimensional representation of Vava’u island and the village of Houma.

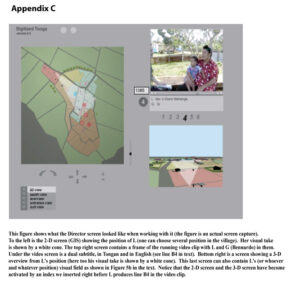
Appendix C
This figure is a screen capture of Director.
Abridged Article with Additional Figures (requires Flash) [currently unavailable]

This work is licensed under a Creative Commons Attribution-Noncommercial-No Derivative Works 3.0 United States License.]